To create a real forex account for free, click here
Forex Crossover Pullback System
A pullback crossover strategy is one of the advanced forex trading strategies.
It includes trading indicators, such as Exponential Moving Averages (EMAs) and Commodity Channel Index (CCI), to detect the direction and strength of a forex pair.
Let’s talk about the forex crossover pullback system in detail.
What is a pullback crossover system?
The pullback crossover is a trend continuation strategy that focuses on the stronger continuation of the trend.
Pullbacks happen when a price moves in the opposite direction for a short term before continuing in the same direction.
You see pullbacks when a price dips for a short term and continues moving in an uptrend.
On the flip side, pullbacks pop up in a downtrend when the price suddenly moves upwards and then continues downward.
A crossover suggests the intersection of the two MAs. When the MAs crossover, it signals a change in the trend.
You can adjust your positions accordingly. Crossovers are essential for determining any reversals or breakouts in market trends.
In the pullback crossover system, we use two EMAs of 20 and 50-period.
The pullback crossover system employs the highest highs and lowest lows to specify a trend before entering the market.
The two EMAs in the trading system act as dynamic support and resistance levels. The area between the two EMAs gives us support and resistance.
The pullback crossover system provides better entry and exit points, making analyzing trends easier.
Which indicators to use for the crossover pullback system?
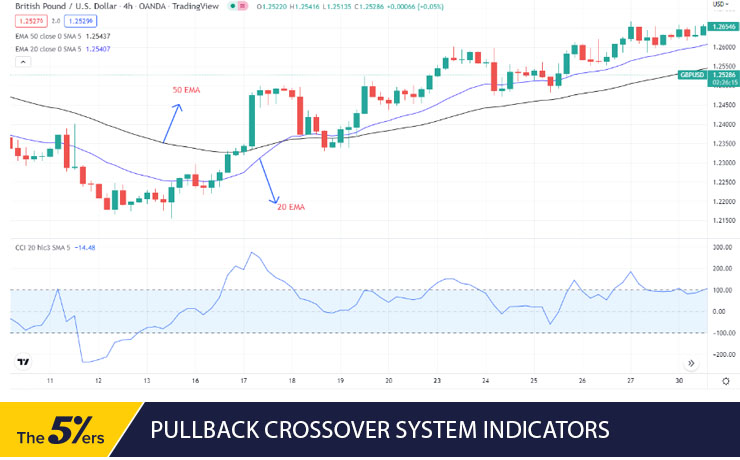
The crossover pullback system utilizes two leading indicators for market trends. One is the Exponential Moving Average (EMAs), and the other is Commodity Channel Index (CCI).
The EMA gives greater weight to the most recent price data. It, therefore, gives importance to the most recent behavior of traders.
The EMA lowers the market noise by shortening the data time lag. It is because the EMA may omit prices that are no longer relevant.
The EMA line is closer to the price activity than the Simple Moving Average because it gives more weight to recent prices.
The two EMAs for the pullback crossover are 20 and 50.
If the 20 line moves above the 50 line, it provides a bullish signal. A bullish signal indicates an upward trend in the market, establishing an entry point.
On the other hand, if the 20 line moves below the 50, it gives a bearish signal.
The other important indicator is the CCI. The CCI is a momentum-based oscillator that determines whether the market is overbought or oversold.
It provides crucial information about the direction and strength of the trade.
In the CCI, if the reading is above +100, the market is overbought. It will soon result in a price drop. Conversely, if the reading is below -100, the market is oversold. As a result, traders can expect an uptrend.
The slope of the CCI signal line also indicates market direction. You should expect high volatility if the slope is too steep. On the other hand, if the slope resembles a natural curve, we can expect a steady price movement.

We Trade Forex – Come trade with us!

Crossover pullback system
Now that you know the crossover pullback system and the indicators you need for the strategy, let’s illustrate how you can set bullish and bearish setups.
Bullish setup
We use GBP/USD on the 4H chart as an example to enter long. You can select any significant pair you want. Although the strategy works well on all forex pairs, it’s better to apply it to the majors, as other pairs are prone to extreme volatility.
To enter long, we need to satisfy certain conditions:
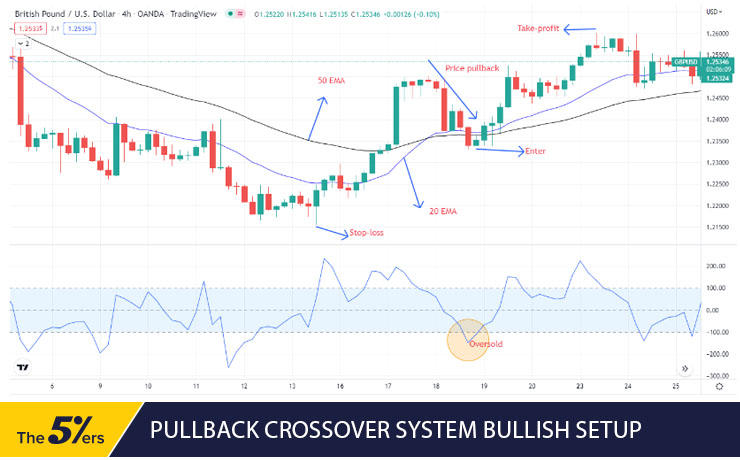
- The 20 EMA should move above the 50 EMA.
- The CCI must be in the oversold zone. It means it should be at -100.
- Wait for the price action to pull back, and then enter afterward.
The chart below shows that the price pullback a bit, giving us an entry point, and the uptrend continues.

The two EMAs act as support and resistance levels, as we mentioned earlier. The 50 EMA acts as a support level in the bullish setup, and the 20 EMA acts as a resistance level.
Notice when the price pullback hits a 50 EMA support level. It suggests the price will continue to move in the long-term uptrend.
Stop-loss
You can place the stop-loss below the recent swing low.
Take-profit
You can set the TP at the recent high from the entry point or 1.5 times the stop-loss in pips.
Bearish setup
We are using GBP/USD again for the bearish setup on the 4H timeframe.
To enter the short trade, you need to satisfy these conditions:
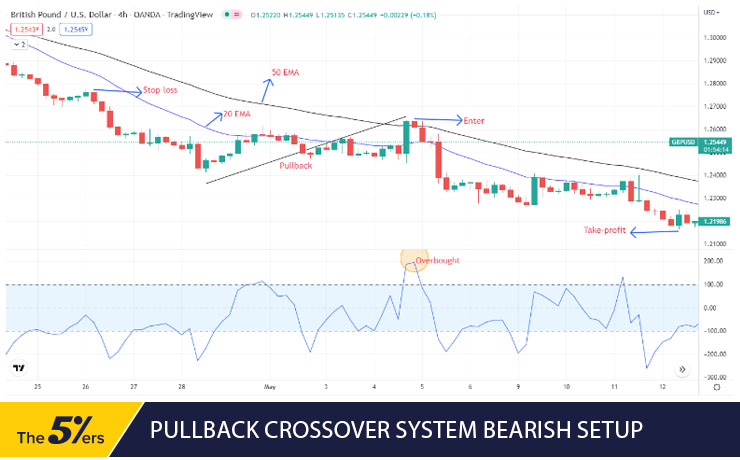
- The 20 EMA should be below the 50 EMA.
- The CCI must be in overbought territory. It means it should be at or near +100.
- Wait for the price action to pull back and then enter.

In the chart above, you can see that we enter the trade when the price pulls back in a downtrend, providing us with an entry point.
In the case of a bearish setup, the 50 EMA acts as resistance, while the 20 EMA acts as a support level. Notice the price hit the 50 EMA resistance level, signifying a short-term uptrend will end.
Stop-loss
You can set the stop-loss near the recent high from the entry point.
Take-profit
You can set the TP at the recent low or 1.5 times the stop-loss in pips.
Pros of pullback crossover strategy
- The pullback crossover strategy is easy to use as there aren’t many indicators involved.
- You get clear indications of buying and selling zones with a pullback crossover system.
- The moving average and the CCI are easy to read and understand.
- New traders can get a hold of this strategy quickly without overwhelming themselves.
Cons of pullback crossover strategy
- Identifying pullbacks can be hard for beginners.
- The strategy doesn’t work in choppy or ranging markets.
Summary
Although the forex crossover pullback system is an advanced strategy, beginners can use it too. You just need to note the certain conditions for entering long and short positions.
The strategy is better than simple crossovers or pullbacks, as it presents a better entry point. Furthermore, the addition of CCI further confirms the signal.
